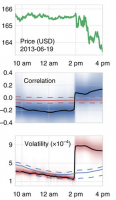
The ups and downs of stock prices are the result of a complex interplay between traditional investors, day-traders and high-frequency hedge funds. The seemingly erratic short-term price fluctuations can be characterized by a diffusion constant – called volatility. However, volatility itself changes significantly over longer time scales. For example, unexpected Twitter announcements may trigger abrupt volatility spikes, while economic policy changes may induce gradual variations of volatility. Financial analysts notoriously struggle to estimate how volatility changes over time and often base their predictions on unsubstantiated assumptions.
In their recent work published in Nature Communications, Christoph Mark and colleagues at the Friedrich-Alexander University Erlangen-Nürnberg in Germany present a mathematically concise way to compare different pricing models for predicting how parameters such as volatility change over time. Instead of evaluating probability distributions of different model predictions analytically, they developed a numerical implementation of the principle of “Occam’s razor” that rewards those models that fit the data with the fewest number of assumptions.
The researchers use this method to show that the so-called fat-tailed distribution of stock market returns (including rare but dramatic events such as Black Fridays and market bubbles) emerges naturally from sudden volatility fluctuations. Moreover, with their method they can pin-point the triggering events (such as news announcements) in real-time.
Volatility fluctuations or, more generally speaking, heterogeneous random walks are not exclusive to finance, however, and also describe the movements of invasive cancer cells, the timing of accidents and disasters, and climate change. Here, their method can be used to identify particularly invasive cells, to determine political measures that may reduce accidents, or to compare different climate models to forecast global warming.
Read the full article in Nature Communications.


